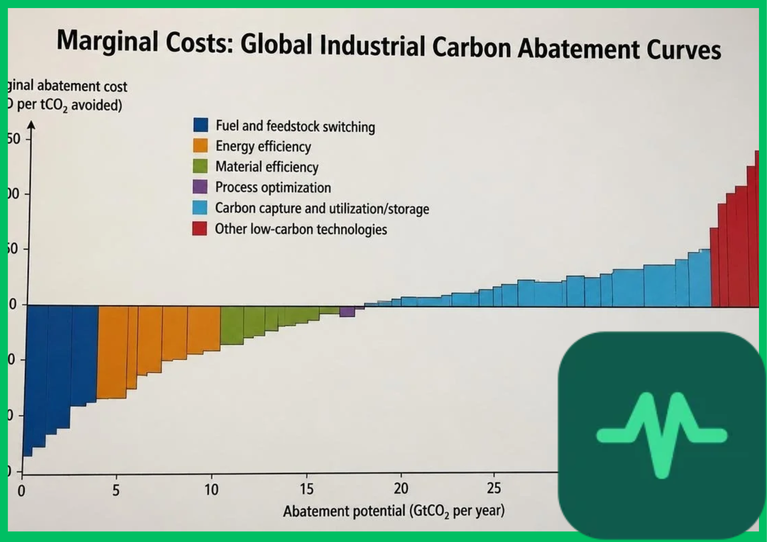
 ) emissions. Because capital allocation for deep decarbonization is constrained by capital expenditure limits and operational return requirements, industrial planners utilize marginal abatement cost (MAC) curves to evaluate the financial efficiency of competing mitigation options. Constructing these analytical curves requires quantifying specific abatement costs per metric ton of carbon dioxide equivalent (
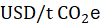 ) alongside cumulative abatement potentials (
 reduction) across industrial process boundaries.
UNIDO
Constructing Marginal Abatement Cost (MAC) Curves
A marginal abatement cost curve is an analytical framework that orders industrial decarbonization technologies in ascending order based on their specific unit cost of reducing greenhouse gas emissions. The horizontal axis displays the cumulative annual greenhouse gas abatement potential measured in megatons ( ), while the vertical axis represents the marginal cost of abatement expressed in dollars per ton of
 abated.
The economic calculation for the marginal abatement cost ( ) of a specific technology or process modification is formulated as:


where 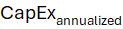 represents the capital expenditure annualized across the economic operating lifespan of the asset using a weighted average cost of capital (WACC), and
 accounts for net changes in operational expenses, fuel costs, and maintenance outlays. Technologies positioned below the zero-cost baseline represent negative-cost measures—interventions where energy efficiency savings or reduced material inputs generate net financial returns over the operating lifecycle. Conversely, technologies positioned above the zero-cost axis require carbon pricing mechanisms, subsidies, or regulatory mandates to achieve commercial viability.
Negative-Cost Abatement Measures and Energy Efficiency
The foundational tier of any industrial marginal abatement cost curve comprises negative-cost interventions focused on waste heat recovery, variable speed drive (VSD) optimization, insulation retrofits, and combustion air preheating. These energy efficiency measures reduce primary fossil fuel consumption and electrical energy inputs, generating financial savings that exceed initial capital outlays.
For instance, installing waste heat recovery units (WHRUs) on high-temperature industrial exhaust streams—such as cement kiln preheater towers operating at  to
 (
 to
 )—captures thermal energy to generate secondary electricity via organic Rankine cycle turbines. While these efficiency gains reduce specific energy consumption (
 of product), their total cumulative abatement potential is bounded by thermodynamic limits. Once basic efficiency measures are fully deployed, industrial facilities must transition to high-cost capital-intensive technological interventions to achieve deep decarbonization targets.
High-Cost Capital Interventions and Transformative Technologies
Moving rightward along the marginal abatement cost curve reveals capital-intensive, transformative technologies required to eliminate process emissions originating from chemical stoichiometry and high-temperature fossil fuel combustion. These measures exhibit high positive marginal abatement costs due to substantial capital expenditures and high operating energy penalties.
- Green Hydrogen Direct Reduction of Iron (
 -DRI): Replacing metallurgical coking coal in primary steelmaking with green hydrogen produced via water electrolysis incurs high abatement costs ranging from
 to
 per metric ton of
 abated, driven by high electrolyzer capital costs and renewable electricity prices.
- Carbon Capture, Utilization, and Storage (CCUS): Retrofitting amine-based post-combustion capture units onto cement kilns or chemical refineries requires capital investments exceeding
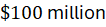 per facility, adding an energy penalty of 15% to 30% that elevates marginal abatement costs to
 to
 per metric ton of
 captured and permanently sequestered.
- Direct Electrification of Industrial Kilns: Replacing fossil-fueled calcination burners with high-temperature resistance or induction electric furnaces operating above
 (
 ) requires robust grid infrastructure upgrades and specialized high-voltage power electronics.
Technical Data Specifications of Industrial Abatement Parameters
| Industrial Abatement & Economic Parameter | Engineering Specification Standard |
|---|---|
| Negative-Cost Energy Efficiency Potential | 10% to 25% baseline energy reduction |
| Waste Heat Recovery Temp Threshold |  to  (  to  ) exhaust streams |
| Green Hydrogen DRI Abatement Cost |  to  per metric ton of  abated |
| CCUS Capture Efficiency Rate | 85% to 95% point-source  capture |
| CCUS Energy Penalty Factor | 15% to 30% auxiliary thermal/electrical load |
| Discount Rate (WACC) Assumption | 7% to 10% industrial capital hurdle rate |
| Global Carbon Pricing Threshold (Net-Zero) |  to  per metric ton by 2030 (IEA projections) |
Dynamic Economic Modeling and Carbon Pricing Integration
Static marginal abatement cost curves possess analytical limitations because they evaluate technologies independently without accounting for cross-sectoral supply chain interactions, technological learning curves, or fluctuating capital costs. As cumulative global deployment of clean technologies—such as proton exchange membrane (PEM) electrolyzers and carbon capture membranes—accelerates, capital costs decline following empirical learning rate curves.
Dynamic marginal abatement cost modeling integrates carbon pricing mechanisms—such as emissions trading systems (ETS) and carbon taxation—to establish economic tipping points. When the prevailing carbon price intersects the marginal abatement cost curve at a specific threshold (e.g., 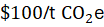 ), industrial polluters face direct economic incentives to abandon fossil-based processes and deploy capital toward zero-emission alternatives. Furthermore, implementing carbon border adjustment mechanisms prevents international market distortions, ensuring that carbon-intensive imports bear fiscal liabilities matching domestic abatement cost curves.
The Final Take
Optimizing marginal costs across global industrial carbon abatement curves provides the economic roadmap required to navigate heavy industry decarbonization. Citing IEA techno-economic assessments and industrial engineering literature, ranking mitigation options from negative-cost energy efficiency measures to high-cost CCUS and green hydrogen technologies enables strategic capital allocation. By aligning corporate investment hurdles with dynamic carbon pricing frameworks, industrial sectors accelerate their transition toward absolute greenhouse gas neutrality.




Comments (0)
Login to leave a comment.
No comments yet. Be the first to share your thoughts!